By the LGAQ Data Dude
We’ve heard in recent weeks how more will be done to alleviate household cost pressures.
Some recent Australian Bureau of Statistics releases provide interesting insights into the situation faced by households. In a selective comparison, data from Household income and wealth (6523) and Selected cost of living indexes (6467) provides some indicators representing the two sides of a ‘typical’ household balance sheet.
The beauty of these indicators is that they have been ‘equivalised’ – apples and apples.
Equivalised disposable household is “calculated by adjusting disposable income by the application of an equivalence scale. The scale is based on the principle that larger households require a higher level of income to achieve the same standard of living as a smaller household.”
On the cost side, the series selected for comparison is the Analytical Living Cost Index for employee households, that is, those households whose principal source of income is from wages and salaries.
Other household income and cost ‘profiles’ are also published by the ABS and provide information on the cost of living situations faced by age pensioner households, other government transfer recipient households, and self-funded retiree households.
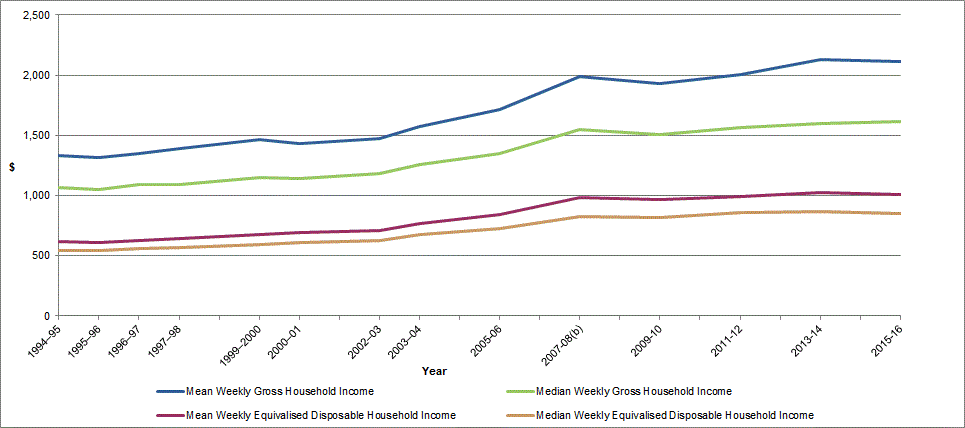
For the ten years to 2015-16, average weekly equivalised disposable household income has increased by about 20 per cent. Over the same period, the living cost index for employee households has increased by about 28 per cent. That represents an annual decline of around 0.8 per cent.
While it’s a small percentage change, and has frequently been described by commentators as a ‘flatline’ (the red line in the graph below), it’s a continuing trend which is no doubt being felt. The experience of households on fixed incomes, including pensioners, will be even more keenly felt.
T his article is from the LGAQ'sCouncil Leader magazine. View it here. If you would like to subscibe to receive a copy please contact us.